Metabase: a data dashboard to run your business in 2026
Metabase for SMBs: centralize your data, build dashboards and track your KPIs in real time. A comparison with Power BI and Looker, and the tool's limits.
 Tech · 6 min
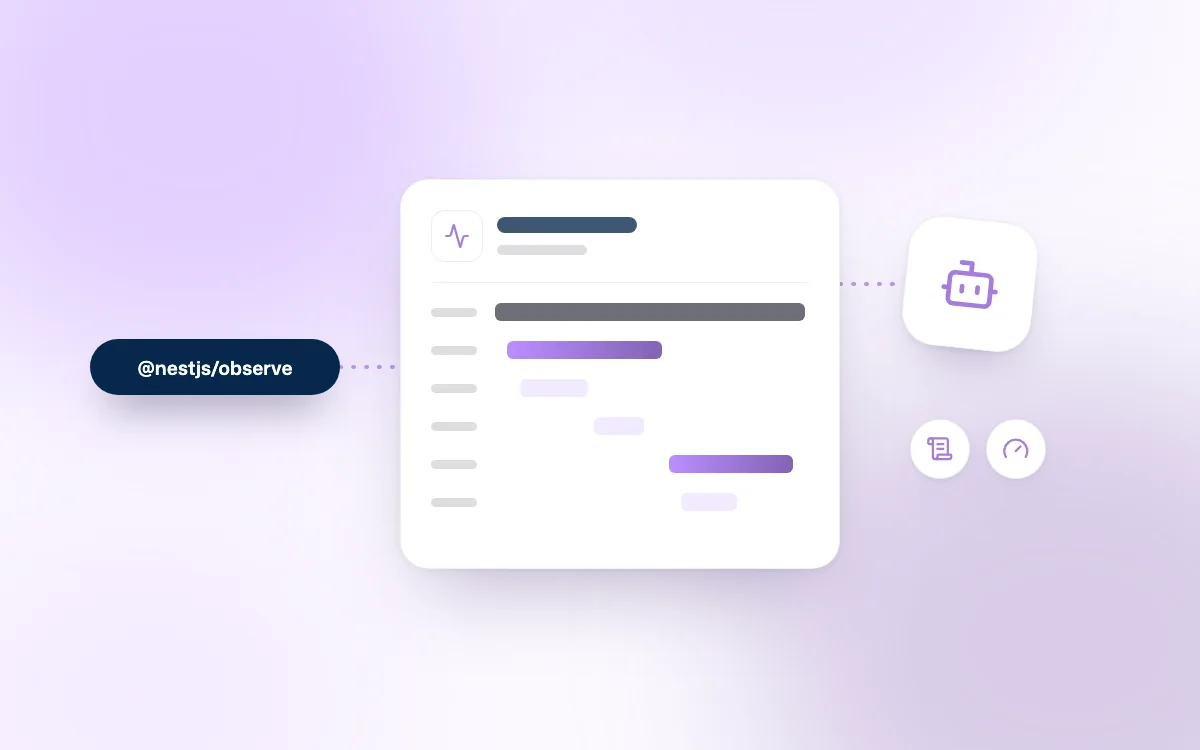
On August 21, 2026, the NestJS ecosystem reached a historic milestone with the release of @nestjs/observe. This "auto-instrumented" observability platform, created by the framework's author Kamil Mysliwiec, promises to end the ordeal of manually configuring OpenTelemetry so you can focus on business value.
NestJS Observe is an observability solution natively integrated into the NestJS framework, designed to automatically capture traces, metrics and logs without any manual work from the developer.
Released as version 0.1.5 at the end of August 2026, the @nestjs/observe package comes with a clear message: "Stop hand-rolling OpenTelemetry". The idea is simple: observability should not be a complex layer added on top of the code, but an intrinsic capability of the framework.
By leveraging a new instrument option introduced in the core of @nestjs/core (version 11.1.4 minimum), NestJS Observe turns any backend service into a transparent system. For teams that have already endured the heaviness of setting up an OpenTelemetry collector or a Datadog agent, the promise is refreshing: full visibility in three lines of code.
Before diving into the tool, it is crucial to redefine the basics. Application supervision, monitoring and observability are often confused, yet their purposes differ:
Observability rests on three fundamental pillars:
At Fragments Studio, we consider observability a pillar of managing technical debt: not seeing what is happening in production means going into debt on resolving future incidents.
OpenTelemetry (OTel) has become the unavoidable industry standard for telemetry. However, implementing it remains a major challenge for many SMBs and scale-ups.
The auto-instrumentation promised by classic OTel agents is never enough. You have to configure an OTel Collector, manage data export, choose a storage backend (Jaeger, Honeycomb, Grafana Tempo) and, above all, maintain this stack. The expertise is rare and expensive.
In 2026, installing OTel is still a surgical operation that often takes several days of tuning to correctly correlate logs and traces. This is the "hidden cost" that NestJS Observe tackles head-on by offering a packaged solution.
The technical implementation of NestJS Observe is disarmingly simple. Installation boils down to:
npm i @nestjs/observeObserveModule.forRoot() to your AppModule with your API keys.main.ts via NestFactory.create(AppModule, { instrument: ObserveInstrument }).Unlike generic agents, NestJS Observe understands the structure of your application. It immediately auto-instruments controllers, guards, interceptors, pipes, GraphQL resolvers, gRPC calls and even BullMQ job consumers.
This is one of the most powerful features of the dashboard: the distinction between Self Time (the time actually spent in a method's own logic) and Total Time (including calls to sub-methods or third-party services). It lets you see at a glance whether a slowdown comes from your algorithm or from a poorly optimized SQL query.
A major 2026 innovation, NestJS Observe includes a read-only MCP (Model Context Protocol) server. This lets tools like Claude Code or Cursor directly access your application's real performance data to help you debug.
If you already use an MCP server for your business tools, bringing your production metrics into your IDE radically changes the Developer Experience.
It is essential to understand one crucial technical point: NestJS Observe is not built on OpenTelemetry.
The upside? A minimal footprint. The package declares only one runtime dependency (@jridgewell/trace-mapping) and no heavy @opentelemetry/* packages. This drastically reduces your application's attack surface, a strong argument given the recent npm package compromises such as Axios.
The downside? No portability. Cross-service correlation uses a proprietary x-request-id header rather than the W3C standard traceparent. Your data is sent to a proprietary backend managed by the NestJS team. You lose the freedom to switch storage providers without changing code.
Moreover, at the time of writing, version 0.1.x is extremely young and does not yet come with a robust SLA (Service Level Agreement) for the critical environments of large enterprises.
Waiting for a user to complain before acting is a risky strategy. In 2026, IT observability is the natural complement to an industrialized CI/CD strategy. It helps you:
NestJS Observe pricing is aggressive: a Free tier (300k events), a Pro plan at $22/month (25M events) and a Scale plan at $74/month. That is significantly cheaper than a Datadog or New Relic stack.
Our recommendation at Fragments Studio:
What is the difference between NestJS Observe and OpenTelemetry? NestJS Observe is a proprietary solution, optimized for NestJS, with a 3-step installation and a light footprint. OpenTelemetry is an open, universal standard, but much more complex to configure and maintain.
Can you use NestJS Observe for free? Yes, there is a free plan that captures up to 300,000 events per month with 3-day retention, which is ideal for testing the tool or for small personal projects.
Does NestJS Observe slow down application performance? The impact is extremely low thanks to the absence of heavy dependencies. Instrumentation is asynchronous and optimized not to block the Node.js Event Loop, which is crucial for building high-performance SaaS applications.
Is it compatible with microservices? Yes, NestJS Observe natively supports context propagation through gRPC, NestJS microservices and asynchronous messages, although it uses its own correlation protocol rather than the W3C standard.
The arrival of NestJS Observe marks the end of the era when observability was reserved for teams with a dedicated DevOps engineer.
Follow Fragments Studio on Google
Add us to your preferred sources and our articles get surfaced first in Top Stories, AI Overviews and AI Mode.
 Tech · 6 min
Metabase for SMBs: centralize your data, build dashboards and track your KPIs in real time. A comparison with Power BI and Looker, and the tool's limits.
 Tech · 6 min
Using Cursor as a team in 2026: how to set up .cursorrules, share context, keep your code secure and compare Cursor with Claude Code and Copilot.
 Tech · 7 min
Scalable software architecture for SaaS in 2026: modular monolith or microservices, horizontal scaling, caching, message queues and the mistakes to avoid.
Fragments Studio handles everything: from strategy to production.
Discuss my project